Log in

Business News

<< First  < Prev   ...   5   6   7   8   9   Next >  Last >> 
  • Mon, April 15, 2019 3:51 PM | Anonymous

    Based on the 2nd Quarter 2019 CIRT Sentiment Index Report, the overall outlook for members remained constant, with the latest figures showing only a slight increase in the CIRT Sentiment Index vs. a marginal decrease in the Design Index when compared with the first quarter. [The CIRT Sentiment Index rose from 64.8 to 65.0, and the Design Index fell from 70.8 to 70.1].  The report’s current trends questions focused on: (1) topics that would be most valuable for research studies; and (2) effects of tariffs on CIRT firms, including: strategies used to combat such effects and how tariffs have changed the costs and availability of supplies.  (See the full report for details).

  • Mon, April 01, 2019 6:28 PM | Anonymous

    The U.S. Census Bureau announced the value put in place of construction for February 2019 was estimated at a seasonally adjusted annual rate of $1,320.3 billion, 1.0 percent above the revised January estimate of $1,307.3 billion. The February figure is 1.1 percent above the February 2018 estimate of $1,305.5 billion. During the first two months of this year, construction spending amounted to $181.9 billion, 1.4 percent above the $179.4 billion for the same period in 2018. 

    PRIVATE CONSTRUCTION:
    Spending on private construction was at a seasonally adjusted annual rate of $994.5 billion, 0.2 percent above the revised January estimate of $993.0 billion. Residential construction was at a seasonally adjusted annual rate of $540.9 billion in February, 0.7 percent above the revised January estimate of $536.9 billion. Nonresidential construction was at a seasonally adjusted annual rate of $453.6 billion in February, 0.5 percent below the revised January estimate of $456.0 billion.

    PUBLIC CONSTRUCTION
    :
    In February, the estimated seasonally adjusted annual rate of public construction spending was $325.8 billion, 3.6 percent above the revised January estimate of $314.4 billion. Educational construction was at a seasonally adjusted annual rate of $76.3 billion, 0.8 percent above the revised January estimate of $75.7 billion. Highway construction was at a seasonally adjusted annual rate of $111.1 billion, 9.5 percent above the revised January estimate of $101.5 billion.  MORE


  • Thu, March 21, 2019 6:09 PM | Anonymous

    The U.S. Census Bureau report, delayed due to the federal government shutdown, had good news related to construction put in place for January 2019 estimated at a seasonally adjusted annual rate of $1,307.3 billion, 3.5 percent above the revised December estimate of $1,263.1 billion. Most of the bounce in the new year came in public sector spending which moved-up nearly 5.0 percent with sizable gains in highway construction. The January figure is 2.4 percent above the January 2018 estimate of $1,276.3 billion. 

    PRIVATE CONSTRUCTION
    :
    Private Construction Spending on private construction was at a seasonally adjusted annual rate of $966.0 billion, 0.2 percent above the revised December estimate of $964.2 billion. Residential construction was at a seasonally adjusted annual rate of $511.4 billion in January, 0.3 percent  below the revised December estimate of $512.9 billion. Nonresidential construction was at a seasonally adjusted annual rate of $454.7 billion in January, 0.8 percent above the revised December estimate of $451.2 billion.   MORE


  • Mon, March 04, 2019 3:40 PM | Anonymous

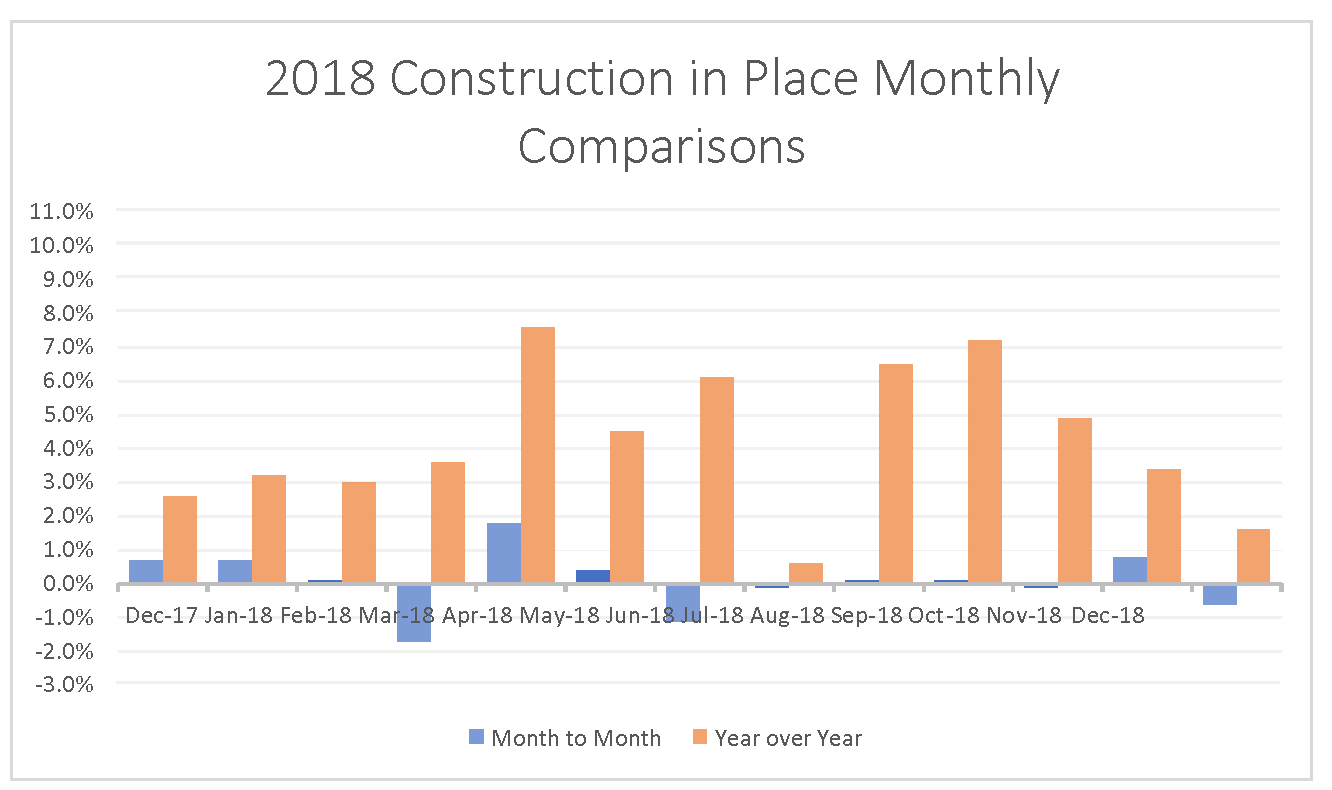
    The U.S. Census Bureau announced the value put in place of construction for the year 2018 was $1,297.7 billion, 4.1 percent above the $1,246.0 billion spent in 2017.  In December construction spending was estimated at a seasonally adjusted annual rate of $1,292.7 billion, 0.6 percent below the revised November estimate of $1,300.6 billion. However, the December figure is 1.6 percent above the December 2017 estimate of $1,272.6 billion.  

    PRIVATE CONSTRUCTION:
    Spending on private construction was at a seasonally adjusted annual rate of $991.2 billion, 0.6 percent below the revised November estimate of $997.1 billion. Residential construction was at a seasonally adjusted annual rate of $536.7 billion in December, 1.4 percent below the revised November estimate of $544.2 billion. Nonresidential construction was at a seasonally adjusted annual rate of $454.5 billion in December, 0.4 percent above the revised November estimate of $452.9 billion. The value of private construction in 2018 was $995.6 billion, 3.4 percent above the $962.8 billion spent in 2017. Residential construction in 2018 was $542.3 billion, 3.3 percent above the 2017 figure of $524.9 billion and nonresidential construction was $453.4 billion, 3.5 percent above the $437.8 billion in 2017.   READ MORE


  • Wed, February 13, 2019 3:02 PM | Anonymous

    CIRT’s Sentiment Index Report for the 1st Quarter of 2019 showed a drop from 66.3 to 64.8 overall, with the subset Design Index falling from 73.4 to 70.8. Both indexes saw a steady downward trend all throughout 2018, with that trend now continuing into 2019.

    Also included in the report, members were asked about their hiring prospects for this year and what they expect to be the biggest challenges for their businesses in 2019.  

    [To read the full 1stQtr 2019 Report and details go HERE].

  • Fri, February 01, 2019 1:58 PM | Anonymous

    Construction spending during November 2018 was estimated at a seasonally adjusted annual rate of $1,299.9 billion, 0.8 percent above the revised October estimate of $1,289.7 billion (which changed down by $19 billion). Release of these figures were delayed by a month due to the partial federal government shutdown. The November ‘18 number is 3.4 percent above the Nov. 2017 estimate of $1,257.3 billion. During the first eleven months of 2018, construction spending amounted to $1,200.7 billion, 4.5 percent above the $1,149.3 billion for the same period in 2017.   Read more HERE.


  • Mon, December 03, 2018 2:22 PM | Anonymous

    Construction spending during October 2018 was estimated at a seasonally adjusted annual rate of $1,308.8 billion, 0.1 percent below the significantly downward revised September estimate to $1,310.8 billion. The October figure is still 4.9 percent above the October 2017 estimate of $1,247.5 billion. The decrease occurred in private sector spending (down nearly $4.3 billion, most of it in residential), while public sector sending held close to September levels, aided in part by the start of a new fiscal year for the federal government. During the first ten months of this year, construction spending amounted to $1,096.4 billion, a solid 5.1 percent above the $1,043.6 billion for the same period in 2017.  Read more HERE.


  • Wed, November 14, 2018 5:12 PM | Anonymous member (Administrator)

    While the overall number of successful ballot measures aimed at funding transportation projects remained about what has been seen in past elections (approximately 75% success rate), mounting resistance to spending plans is showing up in higher negative or no votes.  This is most apparent in the largest ten measures (in terms of total dollars), where only half of them passed for a combined $26 billion (with 92% of those dollars accounted for by only two FL measures), and those failing worth $22 billion.


    There may be a number of factors involved, not the least a general lack of trust in government, but there is also some evidence that use of the funds collected are being diverted.  In a 2010 Reason Foundation policy study it was estimated that nearly a quarter (23.3%, and likely higher since the study) of all Highway Trust Fund user-tax dollars were being diverted to what can be called “non-highway” uses.  This phenomenon is not isolated to federal dollars as determined by a Cato Institute study that found many state user-tax funds are also being used for purposes not strictly defined as highway needs.  While diversion of funds may seem harmless and even convenient, they may have undercut the general public’s appetite for spending measures and hurt the overall trust that the funds will be spent on their intended purpose.


<< First  < Prev   ...   5   6   7   8   9   Next >  Last >> 

Construction Industry Round Table (CIRT) · 8115 Old Dominion Dr., Suite 210McLean, VA  22102-2325 · Legal Notices
Copyright 2024 · All Rights Reserved.

Powered by Wild Apricot Membership Software